thermal infrared
acquired March 31, 2013
download large thermal infrared image (4 MB, JPEG, 7811x7321)
Phoenix has a well-deserved
reputation for being one of the hottest cities in the United States.
With temperatures that routinely spike above 100°F (37.8°C), this
Arizona city has the highest average daily maximum air temperatures of any in the country.
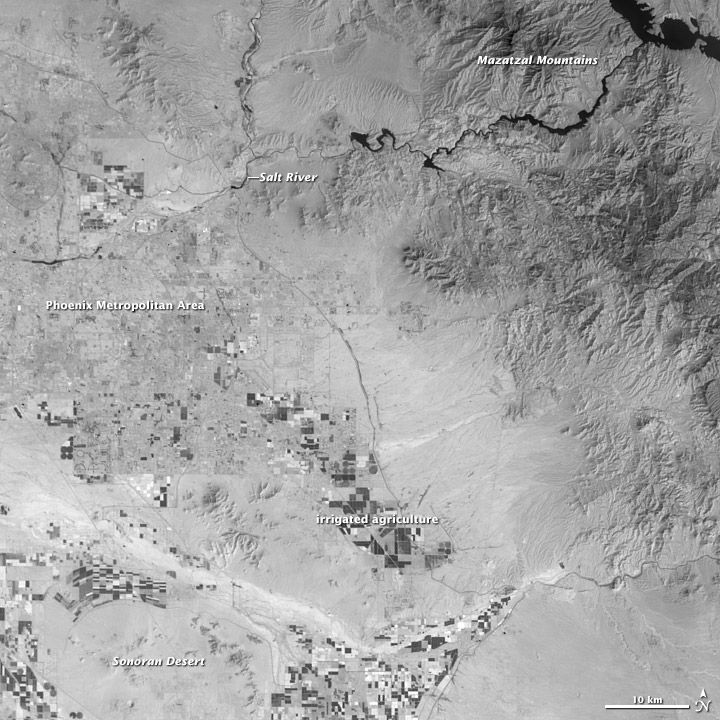
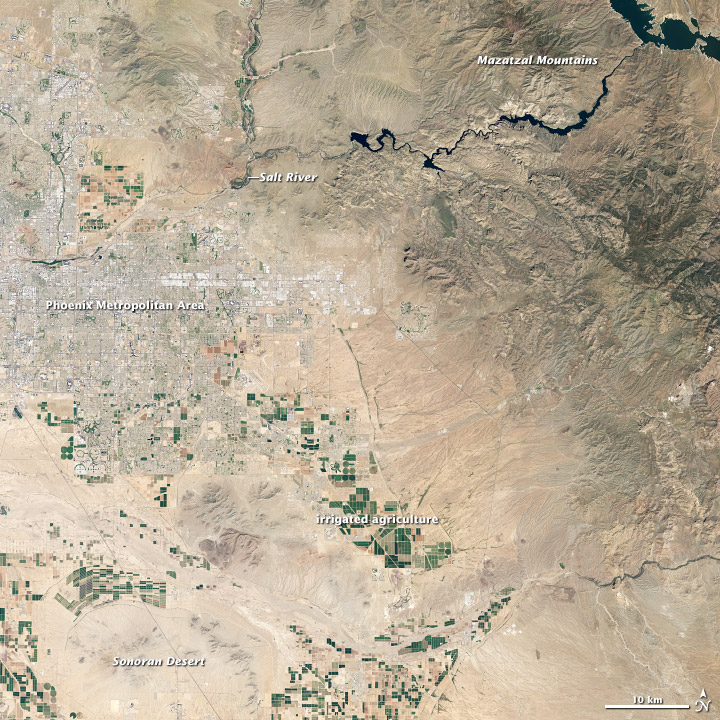
But that’s not to say the land surface temperatures in this sun-drenched city are universally hot. (Read this story for an explanation of how land surface temperatures and air temperatures differ.) Variations in surface temperatures are not visible in the natural-color image above (top), but they are the predominant feature of the thermal infrared image (bottom). The thermal image, based on data collected by the Thermal Infrared Sensor (TIRS), shows how much heat was radiating from various parts of the surface. Cooler areas appear darker; warmer areas are brighter.
Both images were acquired by the Landsat Data Continuity Mission, an Earth-observing satellite that launched from Vandenberg Air Force Base in February 2013. Buildings, roads, and other urban infrastructure appear gray in the natural-color image. The Phoenix metropolitan area has grown rapidly over the past decade, bringing development into parched landscapes of the Sonoran Desert. The city is now home to more than 1.4 million people, making it the sixth largest in the United States.
Supporting such a large population in an area that receives just 8 inches (200 mm) of rain per year requires careful management of water resources. Some key parts of the water distribution system are visible in the natural color image. Theodore Roosevelt Lake and a series of lakes are in the upper corner of the image. These link to the Salt River, a critical conduit for irrigation and human consumption. In the lower part of the image, an area dense with agricultural fields offers a vivid example of how irrigation can create an oasis of green in the midst of the desert.
As seen in the thermal image, the presence of water has a strong impact on land surface temperatures. Bodies of standing water are some of the coolest parts of the image. Likewise, the most heavily vegetated and irrigated areas are cooler than the surrounding landscape because water evaporating from the soil and transpiring from plant leaves absorbs energy that would otherwise go into warming the surface. The lack of vegetation in bare fields leaves those areas warm, while the upper parts of the Mazatzal Mountains are cool and moist enough to support forests.
One of the main reasons the TIRS instrument was flown on LDCM was because thermal measurements on predecessor instruments made it possible to calculate evapotranspiration rates, a key measure that water managers use to gauge how quickly a given area of land is losing water to the atmosphere.
Note that these images are considered engineering data—data that is helping scientists and engineers ensure that the satellite and its instruments are operating as designed. Once LDCM completes its check-out period and becomes fully operational for science, NASA will pass control of the satellite to the U.S. Geological Survey and LDCM will be re-named Landsat 8.
Read more about LDCM’s birthplaces—the locations in the United States where Landsat missions have been conceived, built, and controlled—by clicking here.
References
- Anderson, M. et al (2012, July) Use of Landsat thermal imagery in monitoring evapotranspiration and managing water resources. Remote Sensing Environment, 122, 50-65.
- NASA Landsat Data Continuity Mission. Accessed April 12, 2013.
- NASA The Landsat Program. Accessed April 12, 2013.
- NASA Scientific Visualization Studio (2009, September 9) Evapotranspiration from Landsat. Accessed April 12, 2013.
Further Reading
- NASA Earth Observatory (2012, July 23) Landsat Looks and Sees.
- NASA Earth Observatory (2010, January 21) Water Watchers.
Images by Robert Simmon, using data from the U.S. Geological Survey and NASA. Caption by Adam Voiland.
- Instrument:
- Landsat 8
NASA: US - Hot and Cold in the Arizona Desert - 26.04.13


No hay comentarios:
Publicar un comentario