acquired August 21, 2013
download large image (5 MB, JPEG, 8000x8000)
acquired August 21, 2013
download GeoTIFF file (133 MB, TIFF)
CloudSat
samples the atmosphere, taking the tiniest vertical slices of clouds
and haze and dust and smoke and creating a profile of all that stands
between us and space. This vertical sampling is possible because the
satellite carries a radar instrument
similar to those used to track storms on the ground, but more than
1,000 times more sensitive. The profiles reveal the hidden structure of
clouds and their distribution and abundance.
It is rare, however, for the satellite to fly directly over the
center of a tropical cyclone. On August 11, 2013, CloudSat did exactly
that, capturing a perfect profile of the category 4
Super Typhoon Utor approaching the Philippines. Since its launch in
April 2006, CloudSat has directly intersected the eye of a storm of this
intensity and size only a handful of times.
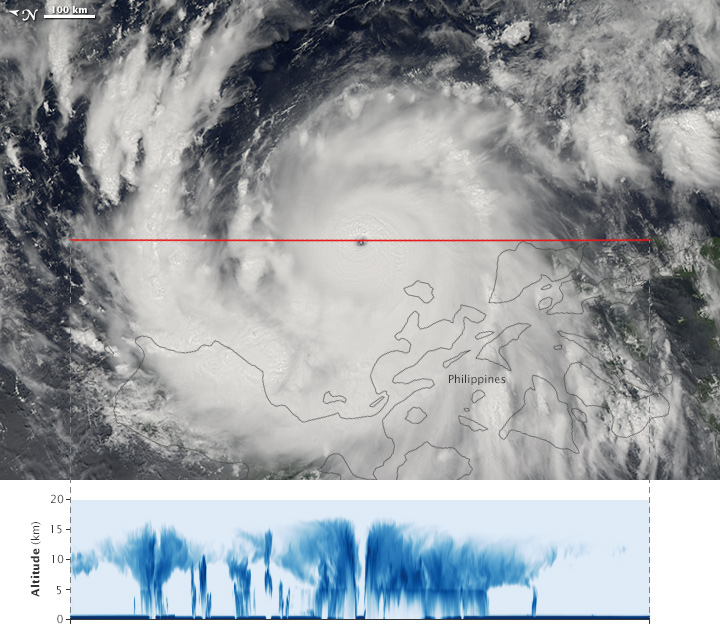
The view of the storm at the top of this page comes from the Moderate Resolution Imaging Spectroradiometer (MODIS) on NASA’s Aqua
satellite, which flies in formation with CloudSat and acquired this
image a few minutes before the CloudSat overpass. The red line shows the
footprint of the CloudSat radar observation displayed in the lower
image. The CloudSat observation is about 10 kilometers east of the
center of the storm, taking in the structure of the eye and eye wall. At
the time, Utor had winds estimated at 115 knots (132 mph) and a minimum
pressure of 937 millibars.
This overpass reveals many unique features of a well-defined and
intense typhoon, including a distinct eye, bands of rain separated by
cloud-free areas, and extremely heavy rain. The dip in the center of the
profile shows an outward sloping eye and strong eyewall. The lack of a
data signal below five kilometers (ten kilometers close to the eye) is
due to heavy precipitation, since the radar pulse loses power traveling
through intense rain. The strong signal elsewhere points to large
amounts of ice and liquid water spread throughout the storm. Dark
stripes are rain bands, and these are separated by moats (cloud-free
areas) beneath the cirrus canopy.
NASA Earth Observatory image by Jesse Allen, using CloudSat FirstLook data provided courtesy of the CloudSat team at Colorado State University. Caption by Natalie D. Tourville and Holli Riebeek.
- Instrument:
- CloudSat - CPR
NASA: Philippines - Dissecting Typhoon Utor - 09.11.13
Ricardo M Marcenaro - Facebook
Blogs of The Solitary Dog:
solitary dog sculptor:
http://byricardomarcenaro.blogspot.com
Solitary Dog Sculptor I:
http://byricardomarcenaroi.blogspot.com
Para:
comunicarse conmigo,
enviar materiales para publicar,
propuestas:
marcenaroescultor@gmail.com
For:
contact me,
submit materials for publication,
proposals:
marcenaroescultor@gmail.com
My blogs are an open house to all cultures, religions and countries. Be a follower if you like it, with this action you are building a new culture of tolerance, open mind and heart for peace, love and human respect.
Thanks :)
Mis blogs son una casa abierta a todas las culturas, religiones y países. Se un seguidor si quieres, con esta acción usted está construyendo una nueva cultura de la tolerancia, la mente y el corazón abiertos para la paz, el amor y el respeto humano.
Gracias :)

No hay comentarios:
Publicar un comentario