
acquired September 12, 2011
download large image (309 KB, PNG, 716x716)
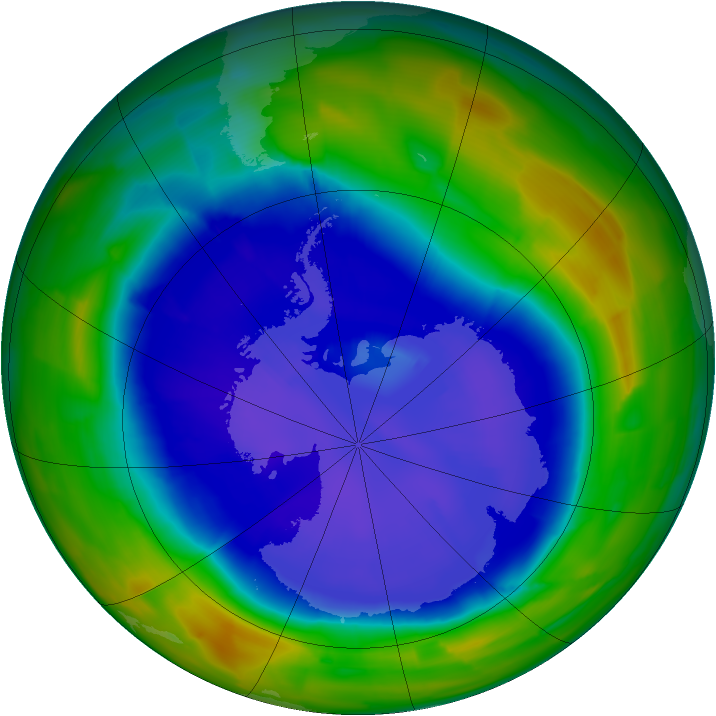
acquired September 22, 2012
download large image (303 KB, PNG, 716x716)

The holes that formed in the ozone layer over Antarctica in 2011 and 2012 are a study in contrasts. The 2011 hole (top left) ranked among the ten largest recorded since the 1980s, while the 2012 hole (top right) was the second smallest.
Why were they so different? Is it a sign that stratospheric ozone is
recovering? These are the questions NASA scientists Anne Douglass,
Natalya Kramarova, and Susan Strahan asked as they examined the holes
using data from instruments on NASA’s Aura and NASA/NOAA’s Suomi NPP satellites.
The images above represent the typical method of gauging the ozone hole. They show the extent (the geographic area covered) and the depth (the concentration of ozone from top to bottom in the atmosphere) as measured by Aura’s Ozone Monitoring Instrument. Blues and purples represent the lowest ozone levels. Each image shows the day of maximum extent—when the ozone hole was largest that year.
But the view of area doesn’t tell the whole story, said Douglass. It says nothing about the chemistry or atmospheric dynamics that give the hole its shape. And if we don't know why the size and depth of the hole varies, it is impossible to know if policies meant to reduce ozone depletion (such as the Montreal Protocol) are having an impact. 2011 and 2012 offer prime examples.
The Antarctic ozone hole forms in the southern spring when chlorine and other ozone depleting chemicals interact with sunlight to destroy ozone. It would be easy to assume that a larger ozone hole means more chemicals were present, but the real picture is more complicated.
“2011 would have had less ozone even without ozone depleting chemicals,” said Strahan. Stratospheric ozone is naturally produced in the tropics and transported to the poles. In 2011, winds blew less ozone to Antarctica so there was less to destroy. Strahan also found less chlorine in the atmosphere over Antarctica in 2011 than in other years, but because there was less ozone, a large hole developed.
In 2012, ozone depletion in the lower atmosphere was severe, said Kramarova. But in early October of 2012, winds blew in more ozone at higher levels, above the depleted area. The high-level ozone masked the destruction at lower altitudes, and so the hole looks small in the OMI image.
All of this means that the size of the ozone hole is not the only indicator of how well policies to control ozone-depleting chemicals are working. “Ozone holes with smaller areas and a larger total amount of ozone are not necessarily evidence of recovery attributable to the expected chlorine decline,” said Strahan. “That assumption is like trying to understand what’s wrong with your car’s engine without lifting the hood.”
In fact, the fluctuating size of the ozone hole has not been tied to chlorine concentrations since the 1990s, as shown in the two graphs above. The first graph depicts chlorine concentrations, and the second shows ozone hole size over time. In the 1980s, ozone hole area increased in step with chlorine concentrations, but that relationship broke down in the 1990s. The atmosphere became saturated with chlorine, and the additional chlorine did not have enough ozone to react with. Adding more chlorine in these conditions no long increases ozone depletion, and so the size of the ozone hole was no longer directly related to chlorine concentrations.
Since the 1990s, the ozone hole area has been controlled entirely by weather. The chemicals that destroy ozone are so long-lived that Douglass, Strahan, and Kramarova don’t expect to see the impact of the Montreal Protocol until about 2025 when chlorine levels drop below saturation. Full recovery should occur sometime between 2058 and 2090, based on projections of levels of ozone-depleting gases and their break-down and transport.
References
- NASA (2013, December 11) NASA reveals new results from inside the ozone hole. Accessed December 12, 2013.
- NASA (2012, October 24) 2012 Antarctic ozone hole second smallest in 20 years. Accessed December 12, 2013.
- NASA Earth Observatory (2011) World of Change: Antarctic Ozone Hole.
NASA images courtesy of Ozone Watch.
Graphs from Paul Newman and Eric Nash, NASA Goddard Space Flight
Center. Caption by Holli Riebeek.
- Instrument:
- Aura - OMI
NASA: Antartica - Antartida - Ozone’s Long Path to Recovery - 01.02.14
Ricardo M Marcenaro - Facebook
Blogs in operation of The Solitary Dog:
Solitary Dog Sculptor:
http://byricardomarcenaro.blogspot.com
Solitary Dog Sculptor I:
http://byricardomarcenaroi.blogspot.com
Para:
comunicarse conmigo,
enviar materiales para publicar,
propuestas comerciales:
marcenaroescultor@gmail.com
For:
contact me,
submit materials for publication,
commercial proposals:
marcenaroescultor@gmail.com
Diario La Nación
Argentina
Cuenta Comentarista en el Foro:
Capiscum
My blogs are an open house to all cultures, religions and countries. Be a follower if you like it, with this action you are building a new culture of tolerance, open mind and heart for peace, love and human respect.
Thanks :)
Mis blogs son una casa abierta a todas las culturas, religiones y países. Se un seguidor si quieres, con esta acción usted está construyendo una nueva cultura de la tolerancia, la mente y el corazón abiertos para la paz, el amor y el respeto humano.
Gracias :)

No hay comentarios:
Publicar un comentario